Proceedings · Session S-638 · filed October 21, 2026
Lab Technology & MethodsSession paper
Raman-NIR Fusion Model Tracks Fermentation Glucose at 99% Accuracy
A dual-stream transformer fusing Raman and NIR spectra explained 99% of glucose variation in fermentation tests, with RMSE of 1.09 g/L across 142 paired records, beating four baseline models.
By Amara Osei3 min read642 words
Summary
- DS-CAT model explained 99% of glucose variation with RMSE of 1.09 g/L on 142 paired Raman-NIR records
- Mean absolute error was 0.89 g/L; results held across five-fold cross-validation
- Strongest prediction sensitivity localized to the 1122–1335 cm⁻¹ Raman band, tied to carbohydrate vibrational modes
- The transformer outperformed PLSR, gradient boosting trees, CNNs and temporal convolutional networks under the same protocol
- Study led by Xiwei Tian (East China University of Science and Technology) and Yinlan Ruan (Guilin University of Electronic Technology), published in Bioprocess and Biosystems Engineering
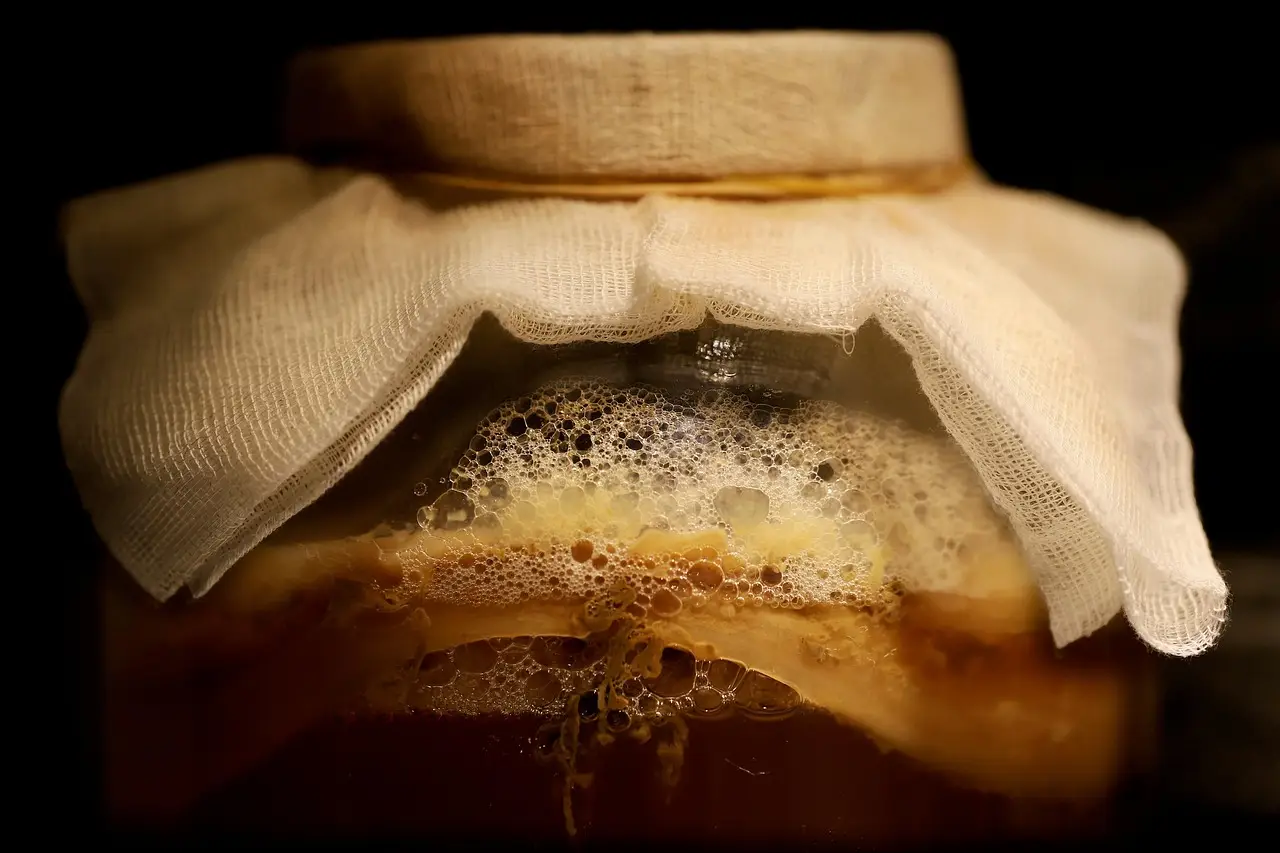
A dual-stream, cross-attention transformer fusing Raman and near-infrared spectra explained 99% of the variation in true glucose concentration during fed-batch fermentation, with a root mean square error of 1.09 g/L. The work, published in Bioprocess and Biosystems Engineering, was led by senior authors Xiwei Tian, DEng, of East China University of Science and Technology in Shanghai and Yinlan Ruan, PhD, of Guilin University of Electronic Technology.
The target is a long-standing bottleneck. Off-line commercial glucose sensors deliver neither the frequency nor the latency that closed-loop feeding strategies demand, a gap that widens as biopharmaceutical manufacturers move toward hybrid and continuous bioprocessing for advanced therapeutics. The developers claim their framework provides "accurate, online-compatible glucose soft sensing" and is also amenable to in-line deployment.
How the sensor works
Raman spectroscopy supplies crisp, chemically specific fingerprints, while NIR contributes broad, information-rich spectral coverage. Rather than mixing raw signals, the team encoded each modality separately and merged them through a dual-stream, cross-attention transformer architecture, abbreviated DS-CAT. The design is intended to let each modality contribute where it is strongest rather than average their weaknesses.
Validation rested on 142 preprocessed, synchronized Raman-NIR records. That sample is modest by industrial standards, and the paper does not state how many distinct fermentation runs or broth compositions those records span. Readers weighing portfolio decisions should note the distinction between a benchmark result on curated data and demonstrated performance on a plant floor.
What do the numbers mean?
The model explained 99% of glucose variation; the field convention treats anything above 95% as good. Its root mean square error of 1.09 g/L sits well inside the tolerance needed for effective feed control, and its mean absolute error of 0.89 g/L — under one gram of glucose per liter of broth — indicates consistent accuracy rather than occasional large misses. Consistency matters here: in real-time processing control, outliers can destabilize feeding strategies more than a slightly higher average error would.
The researchers report that results held steady across five-fold cross-validation, which addresses overfitting on a single train-test split but does not substitute for long-duration drift testing under changing conditions.
Which wavelengths carry the signal?
The team interrogated the model itself. "Prediction-based perturbation…revealed strong dependence on Raman information, while Raman-block sensitivity analysis identified 1122–1335 cm⁻¹ as the interval showing the strongest prediction sensitivity," Tian, Ruan, and colleagues write. That band corresponds to carbohydrate vibrational modes, a physically plausible anchor for a glucose sensor.
The finding aligns with prior literature reports, according to the authors, while the fused framework adds enhanced sensitivity, reduced noise, and reduced drift. Those comparative claims about noise and drift are stated without accompanying figures in the source, so they warrant scrutiny against the full paper.
How does it compare with incumbents?
Under a single evaluation protocol, the researchers state that DS-CAT "outperform[ed] partial least squares regression, gradient boosting regression trees, convolutional neural networks, and temporal convolutional networks." Beating four industry-standard modeling approaches on the same data is the study's strongest practical claim, though the magnitude of the margin over each baseline is the detail R&D managers will want before replacing an established PLSR pipeline.
No funding source or industrial partner is disclosed in the available material, and no deployment timeline is given. The transformer also carries higher computational cost than regression baselines, a factor the source leaves unexamined.
What comes next
If the results transfer beyond 142 records, the high-frequency, low-latency measurements could support closed-loop glucose control in both mammalian and microbial fermentation, forming a rational bridge from fed-batch toward continuous manufacturing. The authors' own framing — "may enable," "if so" — signals that the pathway from benchmark to bioreactor remains untested in production.
via link.springer.com (Original)
Filed under
- raman-spectroscopy
- nir-spectroscopy
- bioprocess-monitoring
- transformer-neural-networks
- soft-sensors
More from Amara Osei
Show full bio
News editor covering money, funding and market shifts around research and development at Hypothesis Wire.
208 articles
References
- LITES Sensor Detects Methane and Acetylene in Real Time
- Takara Bio USA Pairs NGS Library Prep with SPT Labtech Firefly
- DOE Opens Industry-Lab Funding Track for Commercial Partnerships
- Three Bets Aim at Lilly and Novo in Metabolic Disease
- 20,000 Simulated Data Points Plus 65 Bioreactor Runs: A Case for Multi-Fidelity ML in Bioprocessing